Dashboard widgets: numbers, charts, lists and tables
These six widgets are what dashboards are made of. Each one is built in the widget builder: you pick the kind under How should this data look?, a source under Where does the data come from?, then its Display options and an optional Filter. How the builder works as a whole, and the Custom widget that stacks several of them in one card, is on Widgets: the full guide.
Every option below is named exactly as the builder shows it.
| Widget | Shows | Data from |
|---|---|---|
| Metric | One number, with a caption | a view, or a raw query key |
| Chart | A bar or line chart | a view, or a raw query key |
| List | A short list of rows that can link to a record | a view, or a raw query key |
| Table | A table of rows with the columns you pick | a view, or a raw query key |
| Text / Markdown | Text you write | nothing; you write it |
| Goal | Progress toward one goal | the goal itself |
Metric
What it shows
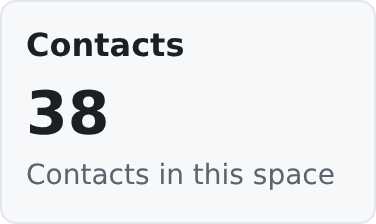
A single headline number, formatted, with a small caption under it.
Where to use it
On dashboards, for a number people check at a glance: how many contacts, how many open tasks. It works on any widget page.
Data source
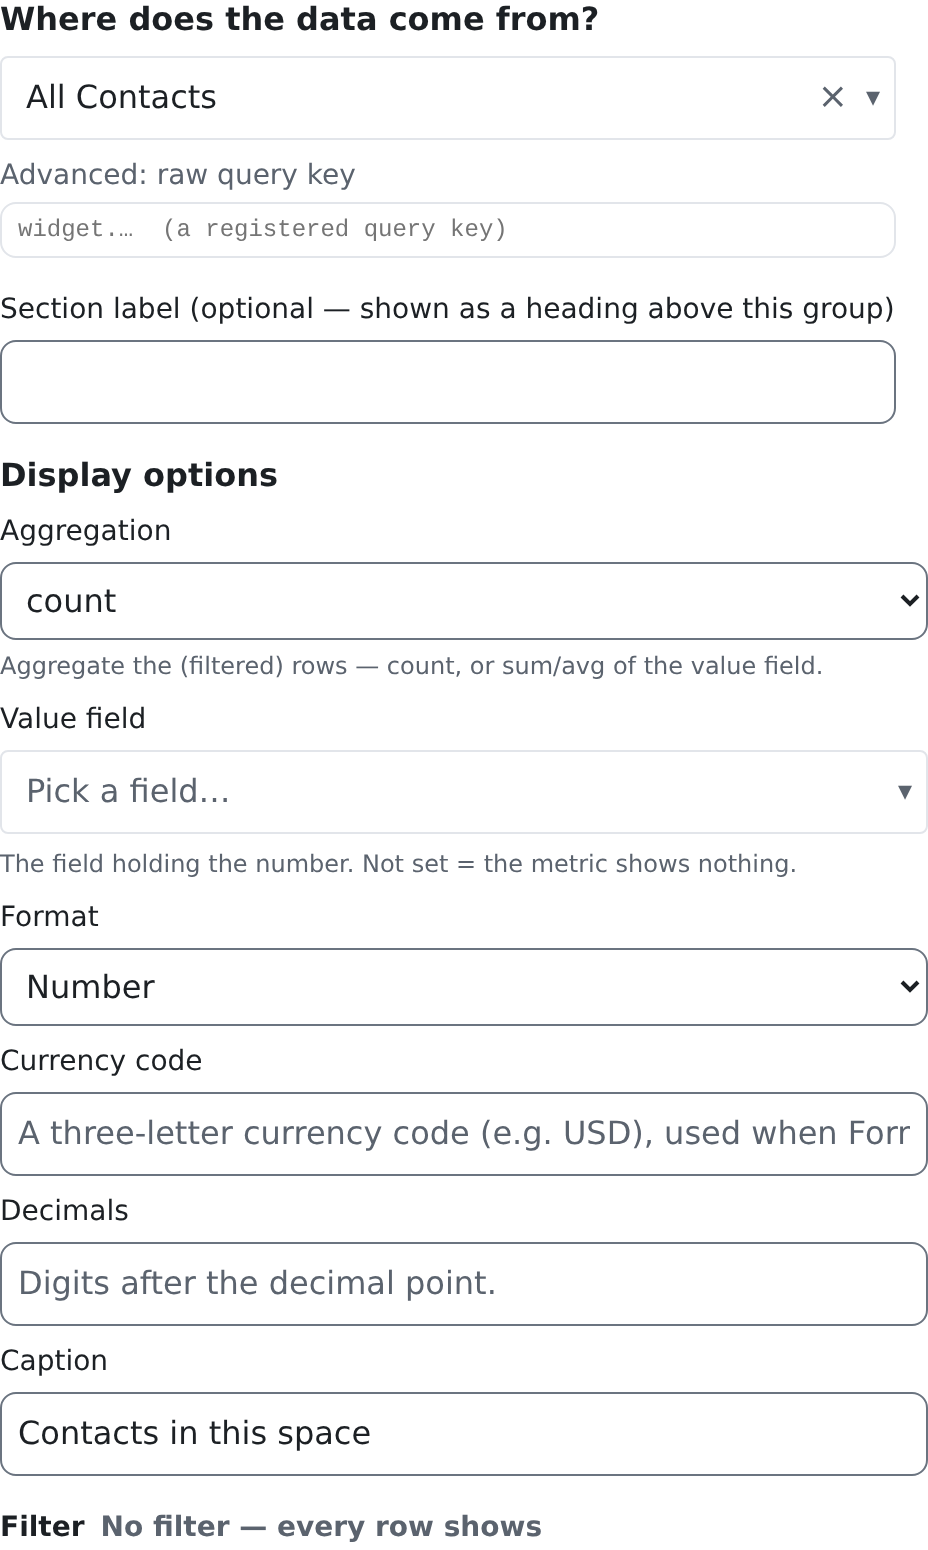
A view or a raw query key. On a view, choose Aggregation: count counts the view's rows (after the filter), sum and avg add up or average the Value field. With no aggregation, the metric shows the Value field of the first row. A raw query key returns its number already counted.
Editor options
| Option | What it does | Default |
|---|---|---|
| Aggregation | Only on a view source. count counts the rows; sum / avg add up or average the Value field. | None |
| Value field | The field that holds the number (with sum / avg, the field to add up). | Not set: with no aggregation, the metric shows nothing |
| Format | Default (number), Number, Currency, Percent or Raw (as-is). Percent reads the value as a fraction: 0.25 shows as 25%. | Default (number) |
| Currency code | The currency, as an ISO code such as USD, when Format is Currency. Without a code the number shows plain. | Not set |
| Decimals | How many digits after the decimal point. | The usual digits for your language |
| Caption | The small line under the number. | No caption |
Filter
On a view source, the Filter chooses which rows are counted. On a raw query key there is no filter: the number is counted in advance, and the builder says so. See Filters for the filter builder. A page on widget filters is coming.
Who can see it
The person needs the source's read permission: for a view, the view's source permission (crm.contacts.read for a view of contacts, crm.work_items.read for a view of work items); for a raw query key, the permissions that query declares. The sample contact count declares crm.contacts.read. Without it, a query metric shows its title and a sentence naming the permission, never the number.
Good to know
- sum and avg need every row. When the view has more rows than one page can carry, the metric shows no number rather than a wrong one.
- count on a view is exact, however many rows the view has.
Chart
What it shows
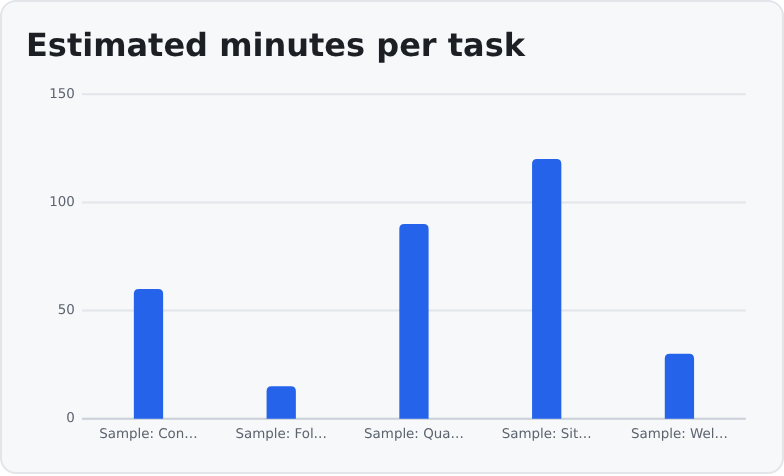
A bar chart or a line chart: one bar or point per row of the source.
Where to use it
On dashboards, to compare a few values or show a trend.
Data source
A view or a raw query key. Every row is one point: the X field is its label and the Y field its value. The chart does not group or count rows by itself. To chart a count per month or per type, use a source whose rows already carry those counts.
Editor options
| Option | What it does | Default |
|---|---|---|
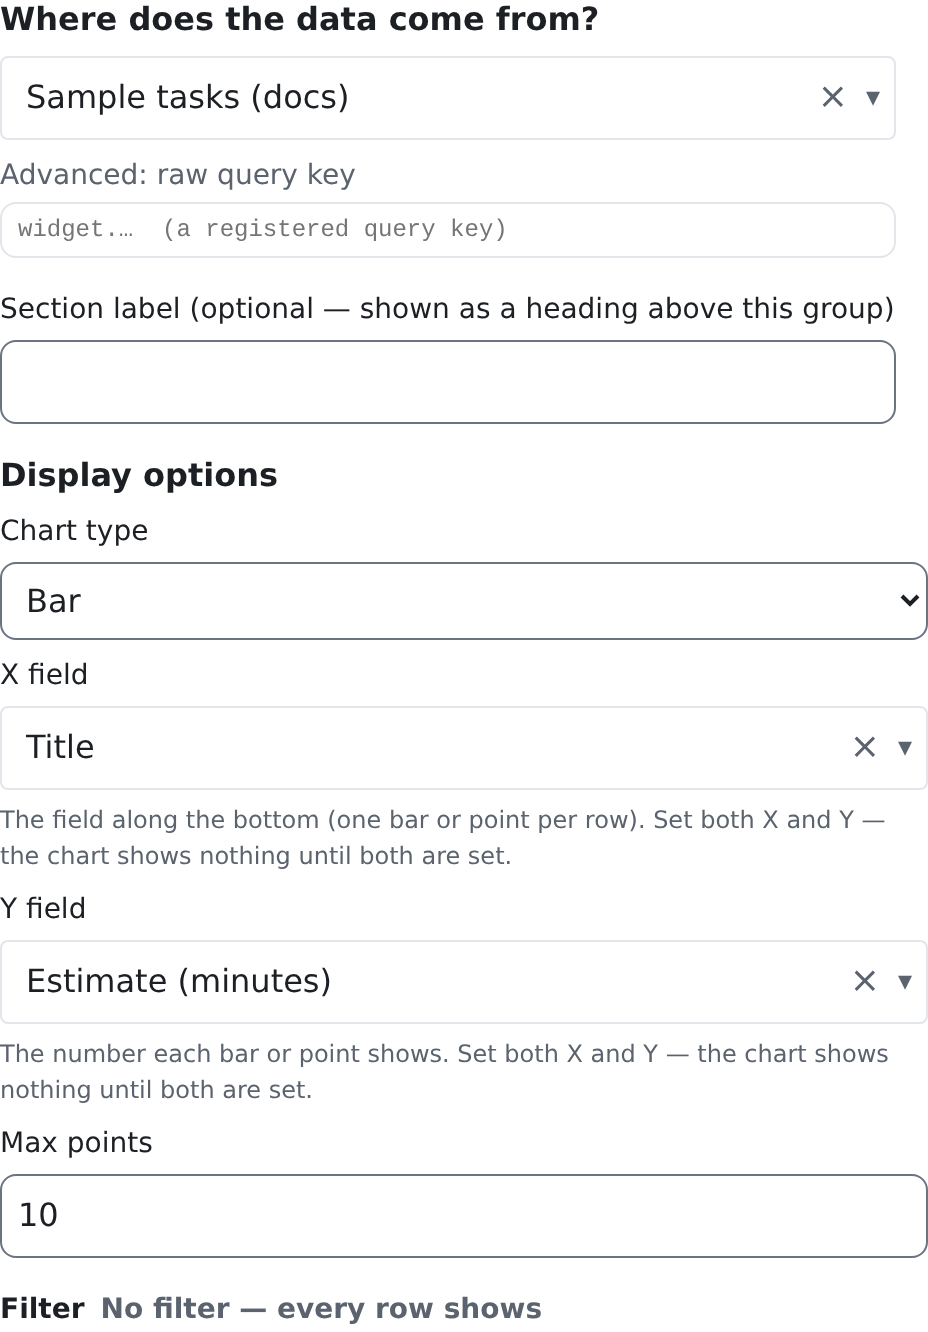
| Chart type | Bar or Line. | Bar |
| X field | The field that labels each point. | Not set |
| Y field | The field that holds each point's value. It must be a number; rows where it is not are left out. | Not set |
| Max points | The most points the chart draws; the first rows are used. | 50, or your space's chart_max_points setting |
Both X field and Y field must be set. Until they are, the chart says No data.
Filter
The Filter chooses which rows become points. See Filters.
Who can see it
The source's read permission, as for the Metric: the view's source permission, or the permissions a raw query key declares.
Good to know
- The chart has one series, so it has no legend: the widget's name says what it shows.
- The axis labels use your language's number format.
List
What it shows
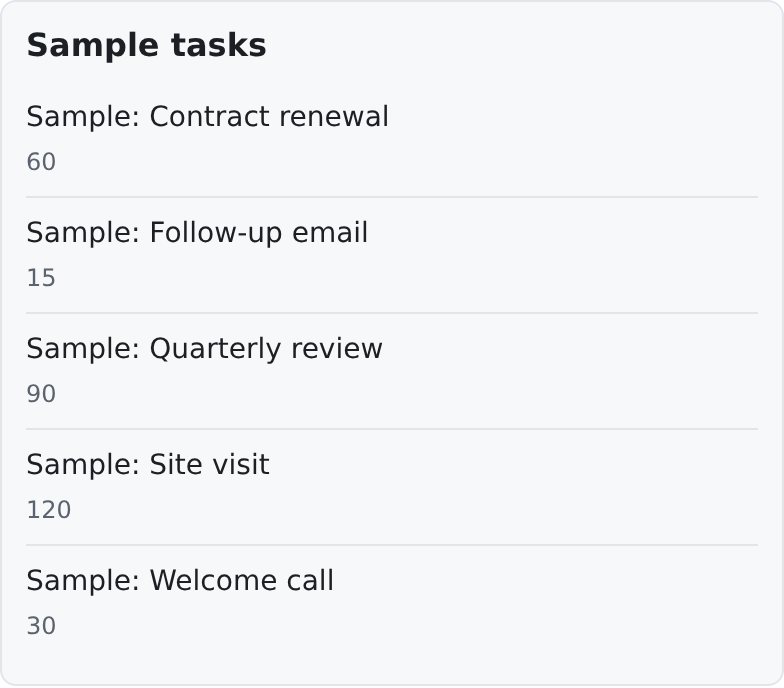
A compact, read-only list: one line per row, with an optional second line. Each line can link to the row's record.
Where to use it
On dashboards, for "the latest" or "the ones to look at": recent contacts, open tasks.
Data source
A view or a raw query key.
Editor options
| Option | What it does | Default |
|---|---|---|
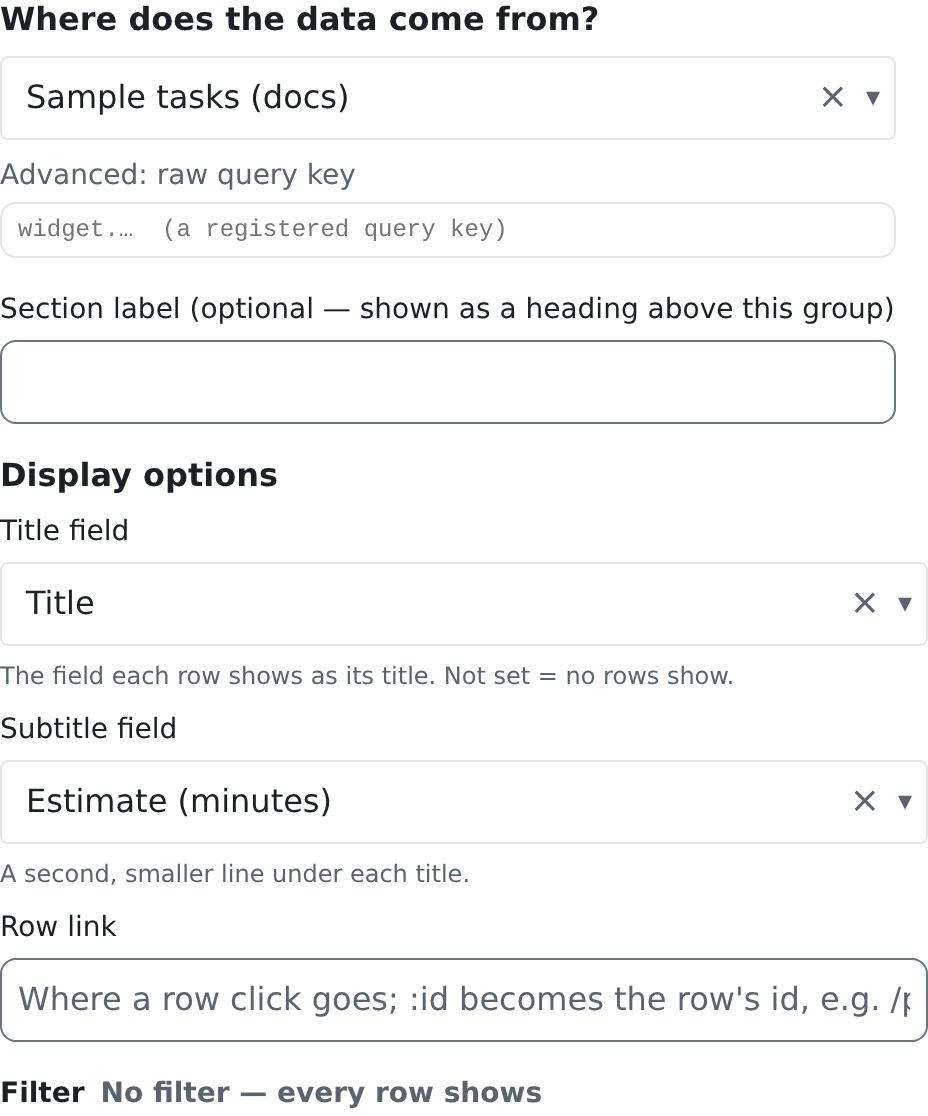
| Title field | The field shown as each line. | Not set: the list shows no rows |
| Subtitle field | A second, smaller line under the title. | No second line |
| Row link | Where a click on a line goes. Write the address with :id where the row's id goes, for example /contacts/:id. | No link |
Filter
The Filter chooses which rows are listed. See Filters.
Who can see it
The source's read permission, as for the Metric.
Good to know
- With no rows (or no Title field), the list says No items.
- A row with no value in the title field is left out.
Table
What it shows
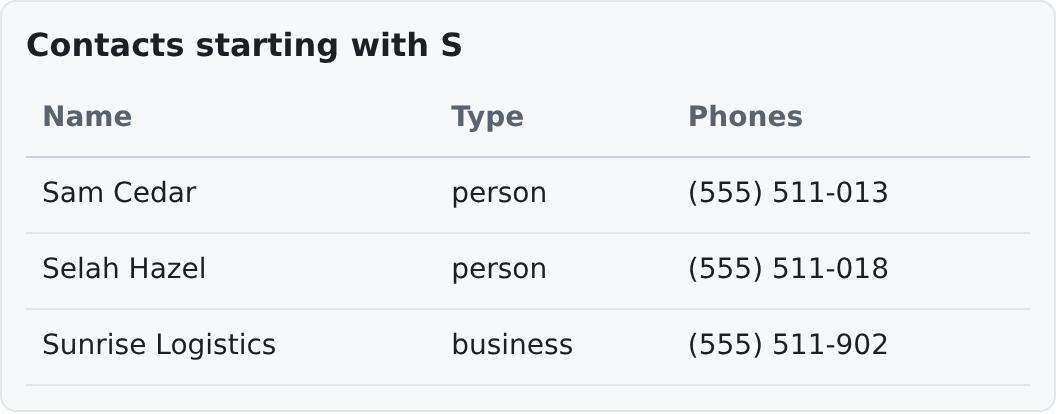
A table of rows with the columns you choose.
Where to use it
On dashboards and pages where people need several fields side by side.
Data source
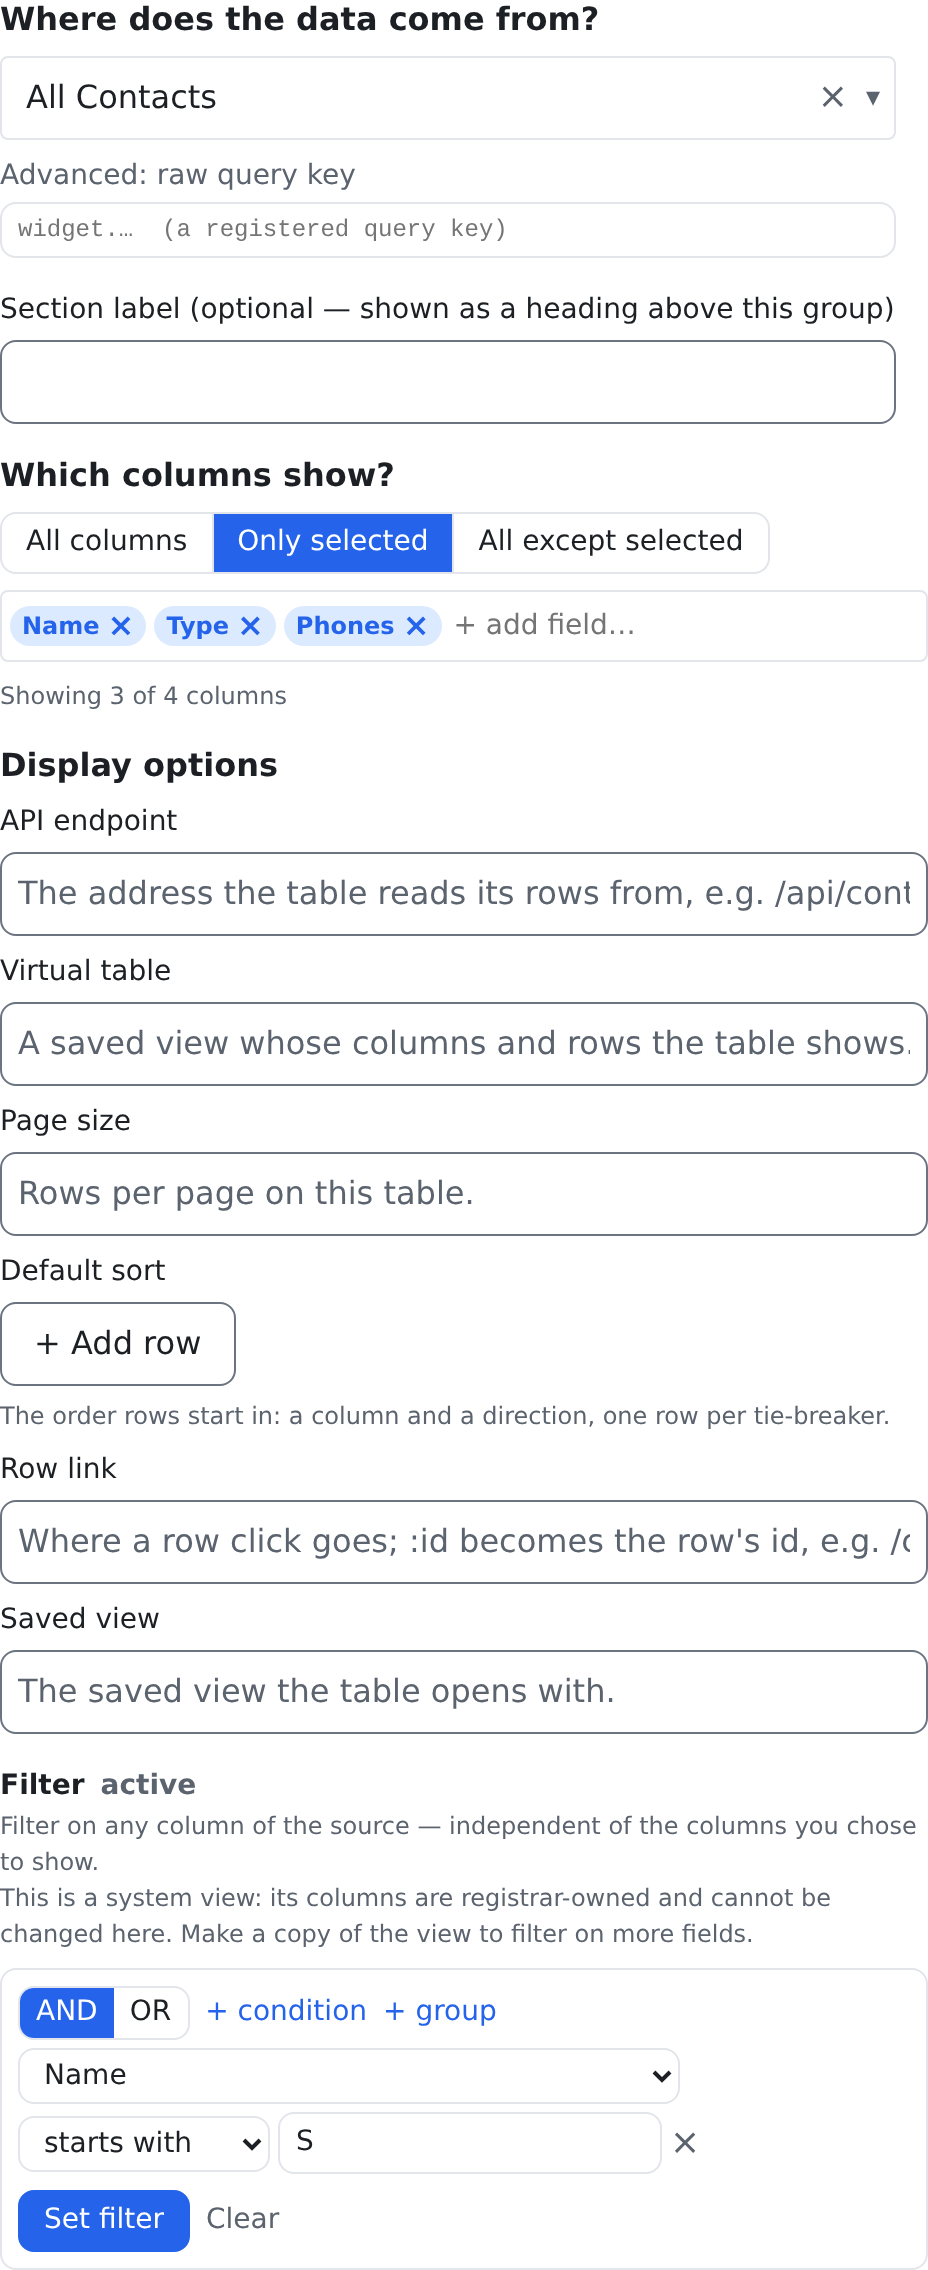
A view or a raw query key. The columns are chosen under Which columns show?: All columns, Only selected or All except selected. Until you choose, the table shows nothing.
Editor options
| Option | What it does | Default |
|---|---|---|
| API endpoint | Shows the table as a full list (sorting, filtering and paging) read from this address instead of the source. | Not set |
| Virtual table | Shows the table as a full list of this virtual table. | Not set |
| Page size | Rows per page in the full list. | The list's own page size |
| Default sort | The full list's starting sort: one or more rows of Column and Direction (Ascending or Descending). | Ascending, when a column is picked |
| Row link | Where a click on a row of the full list goes, with :id, for example /contacts/:id. | No link |
| Saved view | A saved view the full list opens with. | Not set |
Page size, Default sort, Row link and Saved view apply to the full list, that is when API endpoint or Virtual table is set. Without either, the table shows the source's rows as a simple read-only table.
Filter
The Filter chooses which rows the table shows. See Filters.
Who can see it
The source's read permission, as for the Metric. A column the person may not see is not shown to them.
Good to know
- With no rows the table says No rows. When it has no column to draw, it says so in words instead of showing an empty table.
- A Table widget is read-only. To edit records, open them, or use the list itself.
Text / Markdown
What it shows
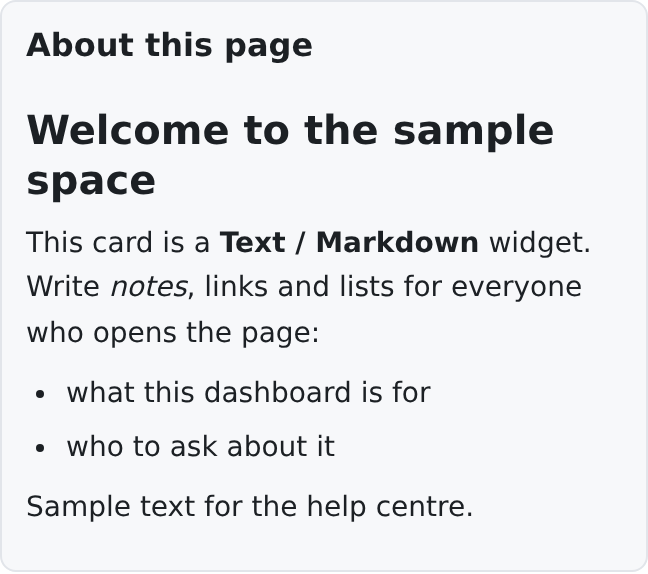
Text you write, with headings, bold, lists and links: a welcome note, instructions, who to ask.
Where to use it
Anywhere. The Welcome card on a new dashboard is one.
Data source
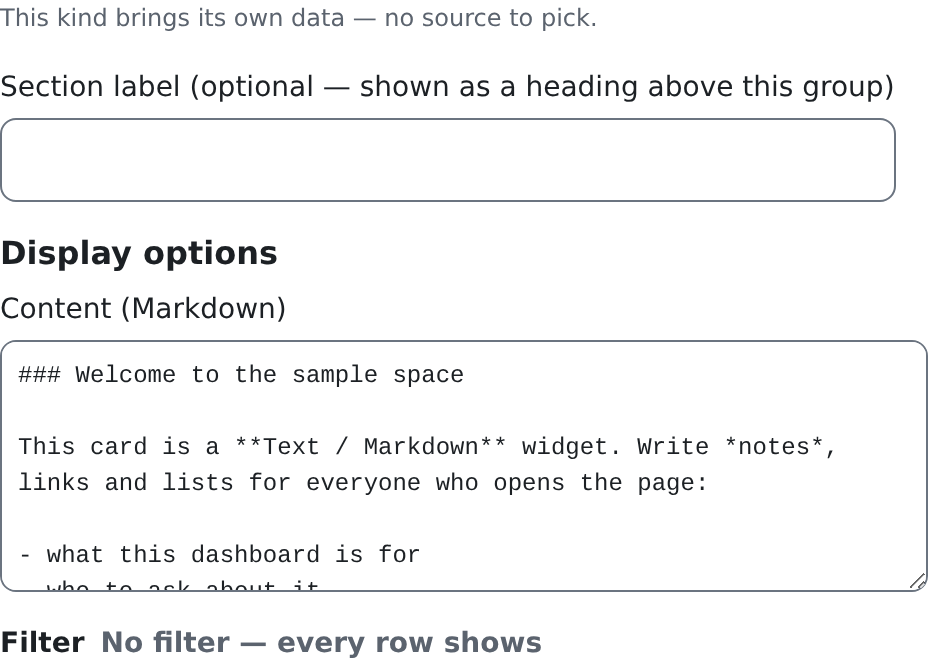
None. The builder says "This kind brings its own data — no source to pick."
Editor options
| Option | What it does | Default |
|---|---|---|
| Content (Markdown) | The text, written in Markdown: ### for a heading, **bold**, *italic*, - for a list, [words](address) for a link. | Empty |
Filter
None: the card shows fixed content, so the builder shows no Filter section.
Who can see it
Everyone who can see the page, unless the placement's Visibility says otherwise (see The Page Designer & Widget Library).
Good to know
- HTML typed into the content is shown as text, never run. Only Markdown formats it.
Goal
What it shows
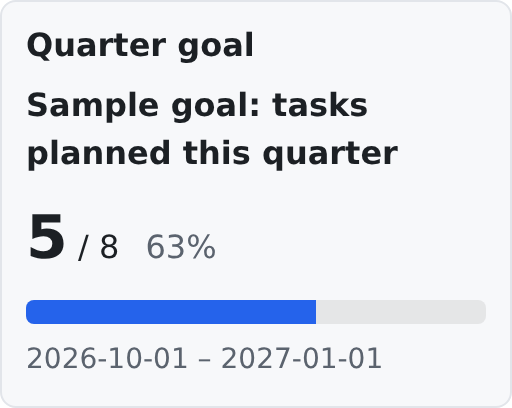
One goal: its name, how far it has come against its target (and the percentage), a progress bar, and the goal's period.
Where to use it
On dashboards, so a team sees how far it has come.
Data source
The goal itself. Goals are made in Goals (/admin/goals): each one has a target, a period, and what it counts: the rows of a view of work items, or a number field of one record. The widget reads the goal's current value.
Editor options
| Option | What it does | Default |
|---|---|---|
| Goal | Which goal to show, picked by name from the goals you may read (with crm.work_items.read). Without that permission the builder keeps a box for the goal's id and says which permission the list needs. | Not set: the card shows nothing |
| Show period | Shows the goal's period under the progress bar. | On |
Filter
None: a goal is one number, so the builder shows no Filter section.
Who can see it
Reading goals needs crm.work_items.read. Making and changing goals in Goals needs crm.work_items.goals.manage.
Good to know
- A goal that no longer exists shows Goal not found. on the card, and Unknown (…) with its id in the builder.
- If a goal's number cannot be worked out (for example its view was deleted), the card says why under the bar.
Related pages
- Widgets: the full guide: the builder, the Custom widget, keys.
- The Page Designer & Widget Library: placing widgets on a page.
- Your Dashboard: how a dashboard is put together.
- Views: the views widgets read from.